STANDARD V: TEACHERS DEMONSTRATE LEADERSHIP |
|
A. School Leadership – Teachers demonstrate leadership in their schools |
B. Professional Leadership – Teachers contribute knowledge and skills to educational practices and the teaching profession |
LMS Tech Contact 2013-14-15-16
August 20th: Sent message to the staff on what is good to bring up to the parents for Back to School Night.
September 4th: Importing Word text into Smart files hint sent to staff via e-mail.
Set up a Tech Contact meeting to be held in LMS library on Jan. 26th from 4:00-5:30P
October 22nd: submitted first of a series of bimonthly Tek Talk blurbs for the LMS Nesletter
November 13th: Second Tek Talk blurb
April 11th: Third Tek Talk blurb
Mentoring New Physical Science Teacher Aug 7: 9:15 – 10:00 AM Heidi Reeg – Angevine
Science representative for Louisville Middle’s MELT decision making team 2015-16
MELT leadership meetings: Aug 12th 8:00AM-1:00PM, Aug 18th 1:00PM-4:00PM, Sep 15th 7:30-8:30AM, Nov 17th 7:30-8:30AM, Dec 15th, Feb 23rd, March 15th
IC Train-the-Trainer course Aug 5: 1:00 – 3:15 PM designated teacher who will be training their peers on the use of Campus Instruction
Presentation August 13th: 6 different 20 min sessions to LMS Staff
Made an IC Messenger Tutorial on Aug. 22nd, and sent to staff.
September 3rd: Helped one staff member view student grades in classes other than hers, another set up gradebook. Several others were helped during the first few weeks of school.
October 16th: Helped staff member with IC messenger. How to locate, navigate, and populate the program.
October 19th: Helped staff member with setting up the gradebook for 15 minutes.
February 12th Professional Development: Facilitator for 6th Grade discussion on utilizing math concepts in curriculum. Video on Teaching Math in 6th Grade Science
March 8th & 9th Peardeck Learning Walks Four different teachers were shown at various times during these two days how the program works, and the benefits of using it for formative assessment.
March 29th Learning Walk Academic Vocabulary with Christine Hannum
Standard III: TEACHERS PLAN AND DELIVER EFFECTIVE INSTRUCTION AND CREATE AN ENVIRONMENT THAT FACILITATES LEARNING FOR THEIR STUDENTSD. Technology – Teachers thoughtfully integrate and utilize appropriate available technology in their instruction to maximize student learning |
|
Implementation of a BYOD Bring Your Own Device plan Parents warned during Back-to-School-Night of the dangers in children bringing their own computers to school – Cyber-bullying, theft, & inherent distractions of the web. Parents and Students must sign a device agreement. The Back-to-School-Night Presentations include a heads-up at the end of the presentation that I am allowing BYOD in my classroom. A full classroom set of 5 year old back-up computers are still available.
Use of a new Formative Assessment tool Peardeck will be used throughout the year
| B. Assessments – Teachers plan and consistently deliver instruction that draws on results of student assessments, is aligned to academic standards, and advances students’ level of content knowledge and skills | H. Feedback – Teachers use appropriate methods to assess what each student has learned, including formal and informal assessments, and use results to plan further instruction |
Peardeck Tested its functionality before school at Digifest
August 19th: Tested Tennis Ball Questions with other science teachers.
August 26-27th: Delivered post project Peardeck questions on the Tennis Ball Height Engineering Group Project. The results revealed that students achieved a high degree of understanding of what it will take to become an effective working team-member for future activities this year. They were able to articulate difficulties and successes when working with their groups to achieve a common goal of levitating a tennis ball. Results were shared with the entire class in all classes.
September 18th: Mid-project delivery of 4 questions on correct usage of data tables and graphing.
The writing pad on the old class set of computers was quite problematic, along with connection problems, but students were able to see results on the board and an estimated 90% or more now know what I am requiring on Graphing in the Science Class
Post Quiz Results October 4th
Quiz 2 1stpage 1
Quiz 2 1stpage 2
Quiz 2 1stpage 3
Quiz 2 2ndpage
show that a comparison of Graphing questions that were more closely related to the rote graphing techniques that were worked on through Peardeck showed a higher percentage of correct answers than those which had not been formatively assessed with Peardeck. A few interesting points to make are that I was probably correct in guessing that 90% or more students know the parts of graphing that were worked through with Peardeck. However, what I was testing was the student’s ability to synthesize that ability to correctly number, label axes, and title a graph altogether when using data in a completely different scenario. This made the testing parameters quite a bit more difficult, so the overall results of 79% is explained by the fact that students were applying that skill in new and unusual situations.
Percentages of Correct answers: Graphing without Peardeck vs. Graphing with Peardeck
After perusing the results, it finally hit me why 6th period would have such skewed results compared to the other 3 periods. The internet connection went out mysteriously during this period. Only a few computers were able to connect, and everyone was scrambling to find a computer that might connect. By 7th period, I had figured out how to manage the fact that less than half of the computers were connecting. I had that period sharing computers as I trouble-shot many of them. Eventually most of these students had a working computer for Peardeck questions.
Post Quiz Results October 30th:
Quiz 3 example p1
Quiz 3 example p2
Quiz 3 example p3
The quiz results unfortunately this time did not show expected results. The questions used to show student understanding of concepts were #8 and #10. Number 8 was chosen as the control to compare against the question most related to the Peardeck previously assessed question number 10. Number 8 was chosen because it required a similar algorithm to number 10. However, because number 8 was first shown in a flipped video, and the lab was done in a particularly exciting method – dropping 11 meter strings with washers off of the tallest part of the building – ,and only one day before the test, the overall understanding of the students was at an all-time high. The Peardeck questions were given a week before, and though they also included a demonstration where students got close to see how their predicted results compared to the actual ball drops into clay, students didn’t do near as well on that question.
A large part of the problem with using question 8 to compare with question 10 may have been that my grading of question 8 didn’t require a formula as part of the explanation, but question 10 did. Maybe the students balked at explaining with a formula. In some ways, I feel that I have failed and need to change my goal of formative assessments. In other ways I am reminded of my over-arching goals as a teacher. I value a constantly changing classroom where the kids are excited to come in and see what new things they will be learning, rather than a boring sameness where differences in labs and demonstration techniques hardly vary. I believe that the Peardeck Formative Assessment technique I am using only occasionally helps kids to hone their explanations, and that using Peardeck questions will never supplant exciting and well displayed demonstrations and hands-on labs. Obviously, the comparison of questions that I use for student understanding needs deeper review.
March 8th & 9th: Used Peardeck questions as free response, pinning, and drawing for the Atomic Theory unit. A two day unit involving the video Atoms, and the textbook pages 102-108. This was about the discovery of the Atom and the experiments that scientists did to find out what Atoms are constructed of, and how those parts interact. Four different teachers were shown at various times during these two days how the program works, and the benefits of using it for formative assessment. I have gained an increasing command of the program. I am now using the Slate controller for controlling my computer projection, and using another computer in the back of the room for watching the kids’ work in real-time. The effectiveness is at a high level, where I feel confident that the students are learning at their highest levels!
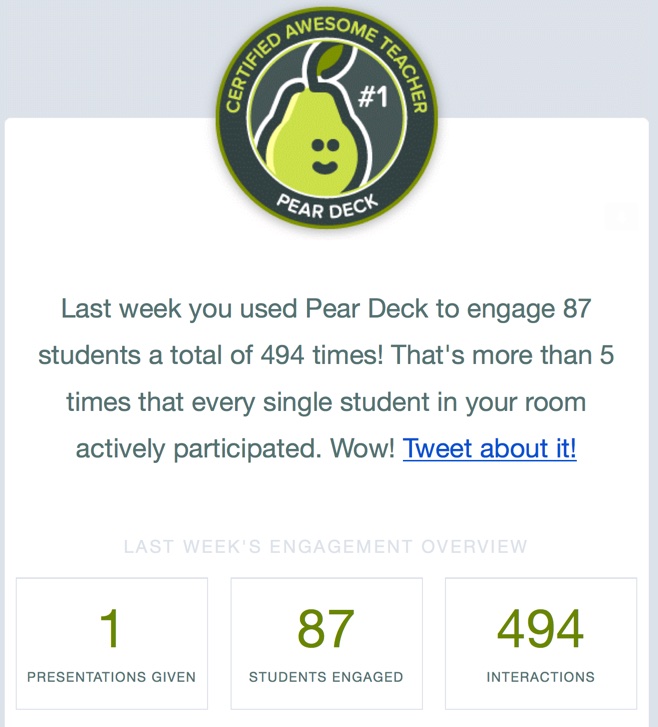
Obviously student engagement is the name of the game when using any formative assessment. Peardeck automatically sends its users updates that show how many times our students engage with the assessment. Here’s a few statistics from this last use on March 8th & 9th. 86 Students were assessed with a total of 629 interactions, which comes out to over 7 times per student during the 2 day lesson.
April 18-20th: Used all forms of Peardeck Formative Assessments to coincide with a movie about Element Discoveries called “Chemistry: A Volatile History of Elements” by Jim Alkalili. For this Peardeck Session, 87 students became engaged for a total of 494 interactions. Following are some example questions and answers showing the full array of Peardeck’s question and answering techniques:
 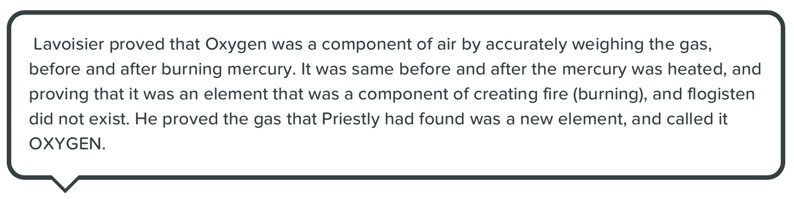 This is the paragraph answer technique. One of our main goals in Science is to help students become better at explanatory answering. I believe this helps them with higher level reasoning. |
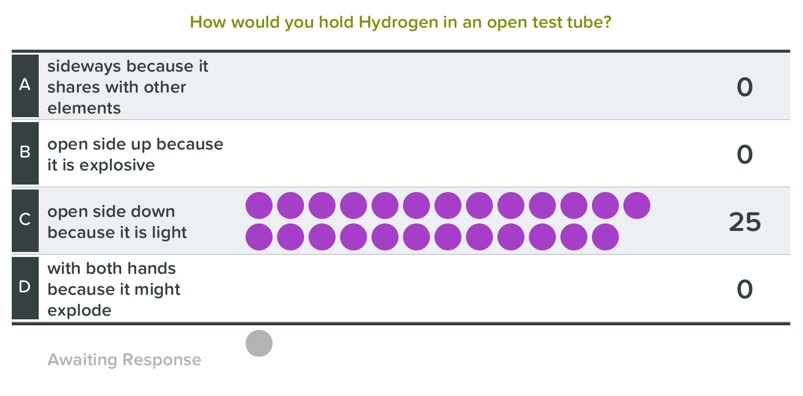 These multiple choice items can show responses in real time, if you want student answers to influence each other. Or, you can hide the responses, and show what the class is doing for a quick check-in by opening the view after the students have had time for all answers. This gives them the chance to first try on their own, then learn from the others after viewing all their answers. |
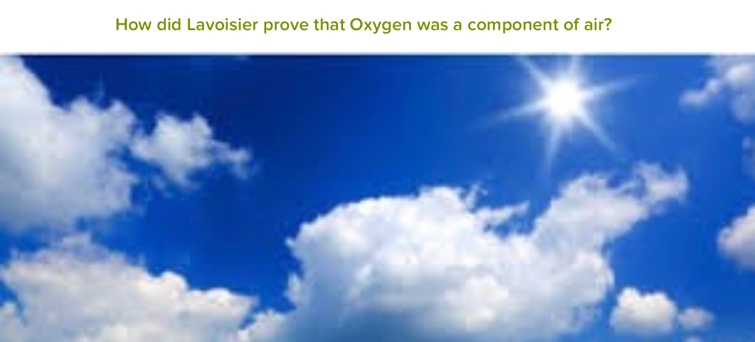
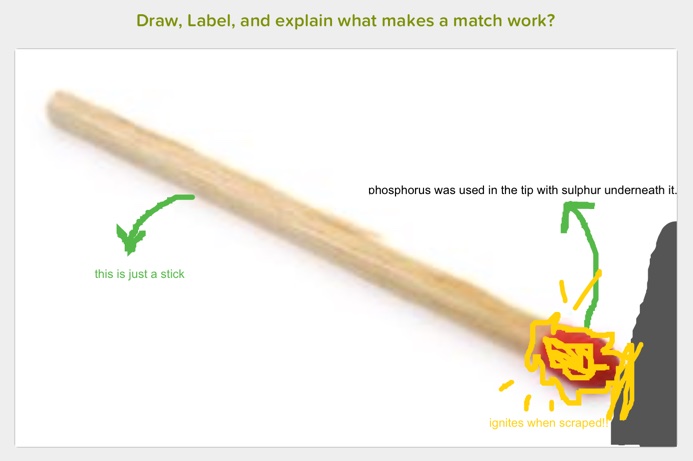 This is the drawing answer technique. Peardeck allows for the presenter to upload any picture as a background to the student’s drawing response. So they can draw their answer over the top of your chosen picture! For labeling, there is a word function available. I have always felt that the ability to draw and label answers is a very important formative assessment technique, lacking in most technological formative assessment tools. Peardeck is clearly a leader in this category! |
 I first showed the section of the video where a flame is put out by “fixed” air full of Carbon Dioxide pouring out of an opening in a brewer’s fermentation kettle. Check out what the student had to do in order to convey that they knew Carbon Dioxide was the gas in Soda. They had to know that it is heavier than air, that it puts out a flame, that they would have to show a match going lower than the rim of the container, that it was first lit, and then went out by smothering with Carbon Dioxide! This drawing of ideas and assimilation of information in a visual context is a vital formative tool for synthesizing information in the child’s Science classroom. I feel that using these visual formative experiences in conjunction with drawing-labeling-explanation type questions on exams are much more effective than the traditional fill-in-the-blank type handouts and tests, especially for the retention of the most difficult concepts in Science. |